In digital image processing, there are different methods for acquiring images, but the goal is the same: to produce digital images from sensed data. Most sensors produce a continuous voltage waveform, the amplitude and spatial behavior of which are related to the physical phenomenon being sensed. We must transform the continuous sensed data into a digital format in order to build a digital image. This necessitates two steps: sampling and quantization.
- Sampling: Digitizing the coordinate values is called sampling.
- Quantization: Digitizing the amplitude values is called quantization.
What is Sampling
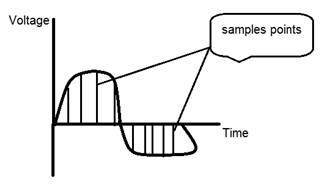
The term sampling refers to taking samples. We digitize the x-axis in sampling. It is done on an independent variable. In case of y = sin(x), it is done on the x variable. It is further divided into two parts, upsampling, and downsampling.

If you look at the above figure, you will see that the signal has some random changes. These changes are the result of noise. By obtaining samples, we can decrease this noise. It goes without saying that the more samples we capture, the higher the image quality, and the less noise there is, and vice versa.
However, if you only sample on the x-axis, the signal is not transformed to digital format until you also sample on the y-axis, which is known as quantization. The more samples you gather, the more data you acquire, and in the case of images, this implies more pixels.
Relationship with pixels
Since a pixel is the tiniest element in an image. The total number of pixels in an image may be computed using the formula
Pixels = total no of rows * total no of columns.
Let’s imagine we have a total of 25 pixels, which equals a 5 X 5 square image. As previously discussed in sampling, more samples eventually result in more pixels. So we took 25 samples on the x-axis of our continuous signal. That refers to the 25 pixels of this image.
This leads to another conclusion: since the pixel is also the smallest part of a CCD array. So it also has a link with the CCD array, which may be stated as follows.
Relationship with CCD array
The number of sensors in a CCD array equals the number of pixels. And, because we found that the number of pixels is exactly proportional to the number of samples, that means that the number of samples is proportional to the number of sensors on the CCD array.
What is Quantization
Quantization is the reverse of sampling. It is carried out on the y-axis. When you quantize an image, you are separating a signal into quanta (partitions).
The coordinate values of the signal are on the x-axis, while the amplitudes are on the y-axis. Quantization is the process of digitizing the amplitudes.
Here’s how it’s done.

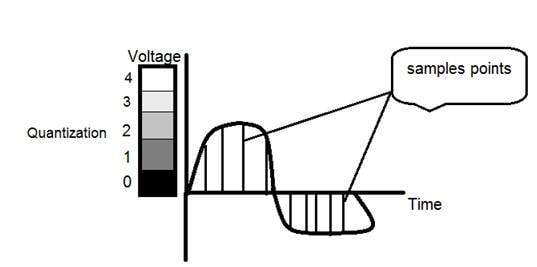
The signal has been measured into three separate levels, as shown in this figure. That is, when we sample an image, we really collect a large number of values, and we assign levels to these values during quantization. This is seen in the graphic below.

Although the samples were obtained in the sampling figure, they were still spanning vertically to a continuous range of gray level values. These vertically varying values have been quantized into 5 separate levels or divisions in the graphic above. 0 is black while 4 is white. This level may vary depending on the sort of image you desire.
The relationship between quantization and gray levels is addressed further below.
Relation of Quantization with gray level resolution
The quantized figure above displays five distinct shades of gray. This indicates that the image generated by this signal would only have five different colors. It would be a black and white image with some grayscale colors. When we wish to improve the image quality, we might raise the levels assigned to the sampled image. When we increase this level to 256, we obtain a grayscale image. This is significantly superior to a plain black and white image.
The mathematical relationship between gray level resolution and bits per pixel can be expressed as follows.
L = 2k
In this equation, L denotes the number of gray levels. It is also known as grayscale. And k stands for a bit per pixel (bpp). So the gray level resolution is equivalent to 2 raised to the power of bits per pixel.
The gray level can be defined in two ways. Which are:
- Gray level = the number of bits per pixel (BPP). (k in the equation)
- Gray level = the number of levels per pixel.
In this scenario, the gray level is set at 256. If we need to compute the number of bits, we simply plug the values into the equation. With 256 levels, we have 256 distinct shades of gray and 8 bits per pixel, hence the image is grayscale.
Difference between Sampling and Quantization
| Sampling | Quantization |
|---|---|
| Digitization of coordinate values. | Digitization of amplitude values. |
| x-axis(time) – discretized. | x-axis(time) – continuous. |
| y-axis(amplitude) – continuous. | y-axis(amplitude) – discretized. |
| Before the quantization process, sampling is carried out. | Quantization is done after the sampling process. |
| Sampling determines the digitized images’ spatial resolution. | Quantization determines how many grey levels are there in the digitized images. |
| Sampling gradually decreases c.c. to a series of tent poles. | Quantization reduces c.c. to a continuous set of stair steps. |

